Remote Sensing of Volcanic Ash
Gary Ellrod, NWA
Remote Sensing Committee (Originally posted September 2005, Updated January 2012) |
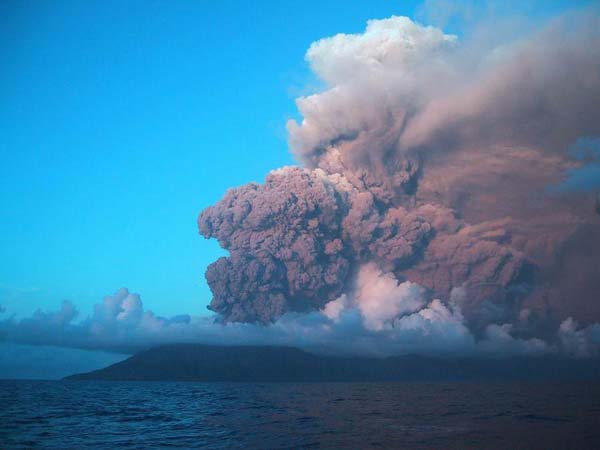 Anatahan Volcano, May 2003 |
Volcanic ash is extremely hazardous to jet aircraft that inadvertantly fly through it. The ash is composed primarily of silicate particles that melt when ingested into the combustion chamber of a jet engine, causing severe loss of engine performance and perhaps, a complete shutdown of the engine. Although no known aircraft have been lost due to volcanic ash encounters, there were two well-known incidents that resulted in near catastrophes to large jet airliners in the late 1980's and early '90s. These incidents lead to the formation of the Volcanic Ash Advisory Centers (VAACs) under the International Civil Aeronautical Organization (ICAO) of the World Meteorological Organization (WMO). Since visual sightings of volcanic ash clouds from the ground or from aircraft are limited, remote sensing techniques based on satellite and radar observations are critical to the (VAACs) and Meteorological Watch Offices (MWOs) in monitoring hazardous ash clouds and issuing advisories such as Volcanic Ash Advisories (VAAs) and SIGMETs to aircraft in flight. Figure 1 shows global areas of responsibility for all of the VAACs.
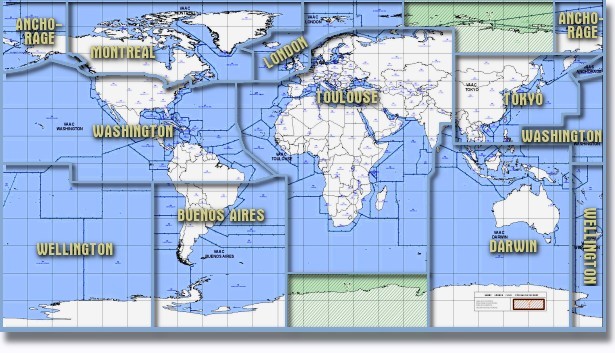
Figure 1. Map showing VAAC areas of responsibility as of 2011. Hatched green areas are unmonitored. (Source: Toulouse VAAC)
Volcanic eruptions have been monitored with geostationary satellite images since the late 1970’s and 1980’s using single band infrared and visible images. Powerful eruptions such as Mt. St. Helens (May 1980) and El Chicon, Mexico (March 1982) were observed in this way. Although single band images are effective for a few hours after an eruption, as the ash clouds became thinner, it becomes difficult to distinguish them from thin cirrus clouds or the underlying surface. By the late 1980’s it was learned that the temperature difference in two longwave IR bands could be used effectively in observing thin ash clouds (Prata 1989).Known as the "split-window" or "reverse absorption" technique, it has become a benchmark for observing ash globally, and for measuring the effectiveness of improved multi-spectral techniques. The image below is a sequence of "split window" image products from AVHRR over a three day period showing the movement of the 17 September 1992 ash cloud from Mt. Spurr, Alaska (Schneider et al. 1995). As the ash cloud crossed the northern United States, it resulted in air route closures and numerous flight delays or cancellations.
Figure 2.
Composite of nine band 4 minus band 5 AVHRR images (from NOAA-11 and NOAA-12) showing
the transport of the 16-17 September 1992 volcanic ash cloud from Mount Spurr, Alaska (Schneider et al. 1995).
_
While the split window method is often effective, there are a number of deficiencies that have been identified such as: (1) the inability to detect ash when the eruption cloud is opaque (usually within several hours of the eruption), (2) obscuration by ice embedded in the eruption cloud, and (3) the masking of low level ash clouds by moist tropical atmospheres. The AVHRR split-window image (along with a band 4 IR image) in Figure 3 was obtained a short time after the Mt. Spurr eruption of 1992 (Schneider et al. 1995). There is little or no positive indication of volcanic ash at this time, other than in a very narrow arc along the southwest edge of the eruption cloud (blue color).
Figure 3. Band 4
minus band 5 AVHRR image (top) and band 4 image
(bottom) from NOAA-11 at 0126 UTC, 19 August 1992 showing the eruption cloud
from Mt. Spurr, Alaska (Schneider et al. 1995).
By the late 1990's additional multi-spectral techniques were developed to improve upon the "split-window" approach by adding information from other IR bands that are sensitive to volcanic ash or other constituents of the ash clouds such as sulfur dioxide (SO2) or sulfates (Ellrod et al. 2003; Pavolonis et al. 2005). Examples are a 3.5-4.0 um IR channel on GOES and AVHRR, and an 8.5 um band on MODIS and METEOSAT Second Generation. The launch of the GOES-12 in the U. S. in 2003 and several follow-on spacecraft requires a different approach, since the 12 u`m IR band was replaced with a 13.3 um channel (Ellrod and Schreiner 2004). Evaluation of the three band technique based on GOES-12 IR channels indicates that it is somewhat less effective than the classic two-band split window method that uses a 12um channel.
The altitude of the ash cloud top is critical for aviation advisories and to accurately predict the future locations of the ash by means of trajectory models such as PUFF or HYSPLIT. The simplest method involves the comparison of IR cloud top temperatures (CTT) to radiosonde or numerical model first guess temperature-height profiles. Since volcanic ash is usually semi-transparent, the CTT method usually underestimates the actual cloud top height. An approach currently in use at some VAACs is to match the drift of the ash cloud with an upper level wind vector from radiosonde, satellite cloud drift, or numerical model data.
An instrument that is being evaluated for use in obtaining ash cloud top heights is the Multi-angle Imaging SpectroRadiometer (MISR)l that was launched on the Terra platform in 1999. MISR provides data in four different shortwave spectral bands looking at both nadir and forward and aft views (26.1°, 45.6°, 60.0°, and 70.5° from vertical). The stereoscopic data can then be used to derive cloud top heights. The images below (Figure 4) show an eruption cloud from Grimsvotn Volcano in southern Iceland at 1300 UTC (1:00pm local) on 22 May 2011 in the visible band at a 60.0° rearward view (left), with the accompanying color-coded cloud height analysis (right). Maximum tops of the eruption cloud were approximately 14 km (45 kft).
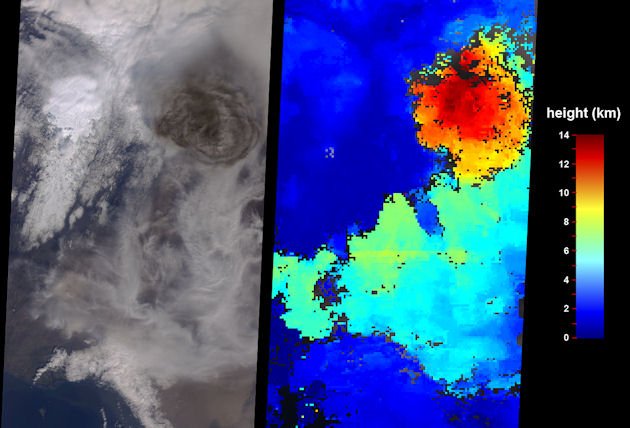
Figure 4. MISR images of an eruption cloud from the Grimsvotn Volcano in Iceland at 1300 UTC on 23 May 2011 from the visible band (left), with the accompanying cloud top height (km) analysis (right). (Source: NASA)
New research techniques under development show considerable promise in providing more accurate estimates of ash cloud area coverage, cloud top height, and other parameters by means of radiative transfer techniques. Figure 5 shows four derived products from the Moderate resolution Imaging Spectroradiometer (MODIS) at 1305 UTC, 19 April 2010 depicting ash being emitted from Eyjafjallajokull Volcano in southern Iceland. The volcano first began to erupt on 14 April 2010, resulting in massive flight cancellations and delays over most of Europe, which had serious global impacts as well.
Figure 5. a) an RGB composite depicting
ash in red, based on MODIS Infrared channels centered near 12um, 11um, and 8.5um, b) ash
loading (tons/km2), c) ash height (km), and d) ash effective radius (microns). Images valid
1305 UTC, 19 April 2010.
In addition to the detection of ash, remote sensing of SO2 can be important to help estimate climatic effects, as well as to warn aircraft in flight about volcanic activity. However, since the SO2 cloud is sometimes at a higher altitude than the ash, its movement can be in a completely different direction, depending on existing wind shears. Ultraviolet detectors originally designed to observe total ozone concentrations (such as NASA’s Total Ozone Mappring Spectrometer) have been adapted to observe volcanic total column SO2 (Seftor et al. 1997). They rely on backscattering from SO2, which differs enough to allow discrimination from ozone. Certain IR channels available on the GOES Sounder and MODIS (especially a water vapor channel centered at 7.3 um are sensitive to SO2 absorption (Prata et al. 2004). Figure 6 compares a two-channel difference image (based on 7.3 – 9.7 um bands) from the GOES Sounder with a TOMS SO2 Index product showing coverage of high altitude SO2 from Soufriere Hills Volcano, Montserrat, on 13 July 2003.
Figure 6. Image of GOES-8 Sounder band 9 (9.7
um minus band 10
(7.4um
at 1320 UTC, 13 July 2003 (left), versus NASA TOMS SO2 Index at
approximately 1530 UTC.
The U. S. Federal Aviation Administration’s (FAA) timeliness requirement for warning en route aircraft about a volcanic eruption is 5 minutes (based on the time required for the Mt. St. Helens ash column to reach cruising altitudes). Most satellites (other than military assets) do not have the refresh rate or spatial resolution sufficient to satisfy this requirement. Another mitigating factor is that extensive cloud cover is sometimes present over volcanoes, preventing the detection of the hot lava or an erupting plume within the cone of the volcano by means of shortwave IR channels. The uncertainty of using satellite data alone also requires some length of time for interpretation of the data, and verification using other sources of information (volcano observatories, pilot reports, etc). Improvements in detection methods under development (e.g. Pavolonis et al. 2005) and automated pattern recognition techniques (e.g. Scott et al. 2001) could reduce this warning time lag in the future.
Ash clouds have also been observed by weather radar in a number of instances (Rose et al. 1995; Lacasse et al. 2004). However, the number of radars near active volcanoes is quite small, and their range is normally limited to about 300 km. There is also the risk of mistaking a thunderstorm for a volcanic eruption, especially in tropical regions. The example in Figure 7 shows how satellite and radar can complement each other in observing and verifying volcanic eruptions. The Anatahan Volcano in the Marianas Islands in the Western Pacific Ocean erupted strongly on 5 April 2005, producing a dense ash cloud that rose to 51,000 ft. Even at more than 300 km from the location of the radar on Guam, strong reflectivity (50 dBz) was observed. Due to relatively stable atmospheric conditions, there were no deep convective clouds in the region on this day. The "split window" satellite product from GOES-9 (right panel) showed a strong ash signal (white) around the edge of the high altitude eruption cloud as well as a lower level ash plume caused by earlier activity.
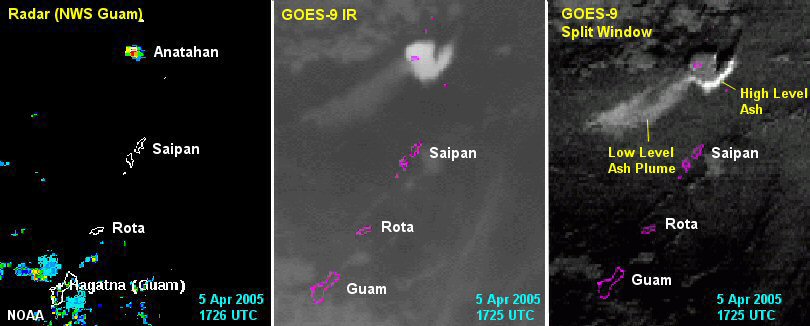
Figure 7. Comparison
of radar reflectivity (0.5 deg scan) from NWS Guam WSR-88D radar (left), GOES-9
band 4 (10.7um
IR (center), and band 5 minus band 4 IR (right) at around 1725 UTC, 5 April
2005.
Links to Realtime Volcanic Ash Detection Images:
Earth Observatory (NASA GSFC, Greenbelt, MD)
Hotspot Detection (University of Hawaii-Manoa HI)
Meteosat Composite Ash Imagery (Eumetsat, Darmstadt, Germany)
Volcano Watch (University of Wisconsin CIMSS, Madison, WI)
Washington VAAC (NOAA/NESDIS, Washington, DC)
References:
Ellrod, G. and A. Schreiner, 2004: Volcanic ash detection and cloud top height estimates from the GOES-12 Imager: Coping without a 12mm Infrared band. Geo. Res. Lett. 31, L15110.
_________, B. Connell, and D. Hillger, 2003: Improved detection of airborne volcanic ash using multi-spectral infrared satellite data. J. Geophys. Res., 108(D12), 4356.
Lacasse, C., S. Karlsdottir, G. Larsen, H. Soosalu, W. I. Rose, and G. G. J. Ernst, 2004: Weather radar observations of the Hekla 2000 eruption cloud, Iceland. Bulletin of Volcanology, 66, 457-473.
Pavolonis, M. J., W. F. Feltz, A. K. Heidinger, and G. M. Gallina, 2005: A daytime complement to the reverse absorption technique for improved automated detection of volcanic ash. J. Oceanic and Atmospheric Tech., 23, 1422 - 1444.,
Prata, F., 1989: Observations of volcanic ash clouds in the 10-12 mm window using AVHRR/2 data. Int. J. Remote Sensing, 10, 751-761.
_______, A. Schreiner, T. J. Schmit, and G. P. Ellrod, 2004: First measurements of volcanic sulfur dioxide from the GOES Sounder: Implications for improved aviation safety. Proceedings, 2nd Intl. Conf. on Volcanic Ash and Aviation Safety, 21-24 June 2004, Alexandria, Virginia, Paper number 3.7.
Rose, W. I., A. B. Kostinski, and L. Kelley, 1995: Real time C band radar observations of 1992 eruption clouds from Crater Peak/Spurr Volcano, Alaska. U. S. Geological Survey Bulletin 2139, 19pp.
Schneider, D. J., W. I. Rose, and L. Kelley, 1995: Tracking of 1992 eruption clouds from Crater Peak vent of Mount Spurr Volcano, Alaska, using AVHRR. In: The 1992 eruption of Crater Peak vent, Mount Spurr Volcano Alaska, U. S. Geological Survey Bulletin 2139, edited by T. E. C. Keith, pp 27-35.
Scott, T. R., K. A. McDonald, and R. W. Lunnon, 2001: Automatic detection of volcanic ash using Meteosat. Forecasting Research Tech. Report 369, Met. Office, London.
Seftor, C. J., N. Hsu, J. Herman, P. Bhartia, O. Torres, W. Rose, D. Schneider, and N. Krotkov, 1997: Detection of volcanic ash clouds from Nimbus 7/Total Ozone Mapping Spectrometer. J. Geophys Res. 102(D14), 16,749-16,760.
![]() NWA Remote Sensing Committee Homepage
NWA Remote Sensing Committee Homepage